
The position of Pakistan in the global FDI network and comparison with that of the other two important players in the South Asia region: India and Bangladesh
- Introduction
In today’s highly connected world, countries entertain a rich spectrum of relationships that include trade and foreign direct investment (FDI). Indeed, this latter mode of interaction has recently become gained importance, complementing or even replacing other, more traditional modes of interaction, such as trade. It is not surprising, then, that a country’s economic success increasingly depends on its position in the global FDI network. This article aims to share some interesting insights concerning Pakistan’s position in the global FDI network and its evolution over time. We would also like to compare Pakistan’s situation with that of the other two important players in South Asia, India and Bangladesh. Our FDI data for these countries span the period from 2009 to 2023. Our data source is the Direct Investment Positions by Counterpart Economy dataset (DIP) by the International Monetary Fund (IMF)[1]. Initially, we shall provide a snapshot of Pakistan’s position in the FDI network in two selected recent years (we chose 2020 and 2023). Then, we will provide similar snapshots with respect to India and Bangladesh and make some comparative remarks. Finally, we will look into the evolution over the available time interval of Pakistan’s position in the FDI network, along with that of its neighbors India and Pakistan, and conclude.
- Pakistan’s FDI Analysis
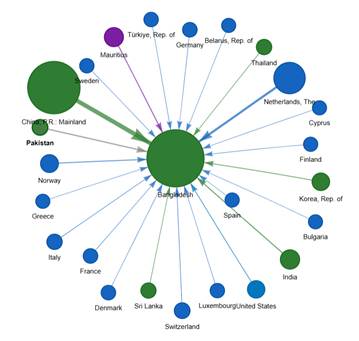
Fig. 1 – Foreign Direct Investment Positions into Pakistan, 2020 (left) and 2023 (right)
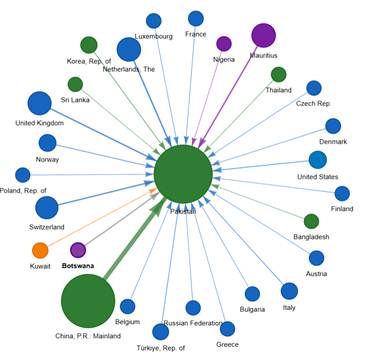
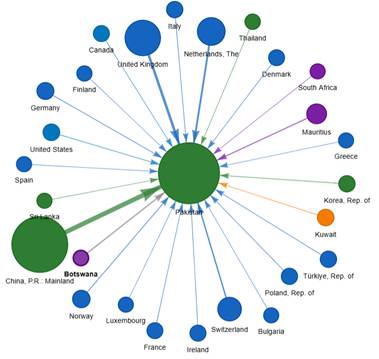
We start with the above snapshot of Pakistan’s inward FDI network in two selected years, 2020 (left panel, Fig. 1) and 2023, the most recent year we have (right panel, Fig. 1).
In 2020, the total number of countries investing in Pakistan was 27 (or 25, if the two offshore financial centers of Mauritius and Luxembourg are excluded, see below), down to 26 in 2023 (or 24, after again excluding the two OFCs). Borrowing from social network theory, this statistic can be interpreted as the in-degree centrality of Pakistan in the global FDI network, namely, the number of other nodes (countries) in the network that have edges leading to Pakistan. This important interpretation provides insight into the centrality of Pakistan in the global FDI network, particularly when compared with similar measures for other regional players, India and Bangladesh. Investment in Pakistan in 2020 totalled $ 14,127 million, up to $ 15,971 million in 2023. This, too, is a measure of centrality, namely, the weighted in-degree centrality, for Pakistan in the global FDI network.
To the reader familiar with the economic dynamics of that region, it should come as no surprise that the largest foreign investor to Pakistan in both years was China, with $ 6,219 million and $ 6,302 million inward investment towards Pakistan, respectively. Much of this investment is part of the scheme known as China-Pakistan Economic Corridor (CPEC), an ambitious infrastructure project initiated in 2015, part of a broader Chinese foreign direct investment strategy known as the Belt and Road Initiative. A detailed description of CPEC is not part of the scope of this article, so it is omitted, and the reader is referred to appropriate sources on the subject. In 2020, the country in second place, Mauritius, is part of a list of countries known in the literature on FDI as offshore financial centers (OFC, see Clark & Kentor, 2022, for a list of 24 countries classified as OFC); hence, investment stemming from this country may not be substantive but merely a kind of financial engineering with the goal of tax avoidance. In the same year, the country ranked third (second in terms of substantive investment), the Netherlands, with an inward investment position towards Pakistan of $ 1,469 million, followed by the United Kingdom with $ 1,406 million investment towards Pakistan. In 2023, the United Kingdom and the Netherlands swapped places in the ranking, with the former becoming the second-largest investor and the latter the third-largest. Of note is the absence in both years of India, Pakistan’s large regional neighbor, from the list of investors, while Bangladesh, the other regional player, is only ranked 20th in 2020 and absent in 2023.
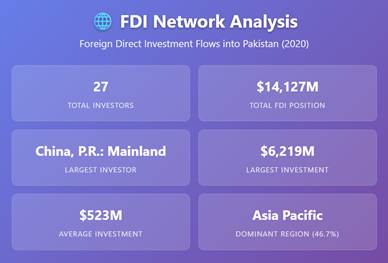
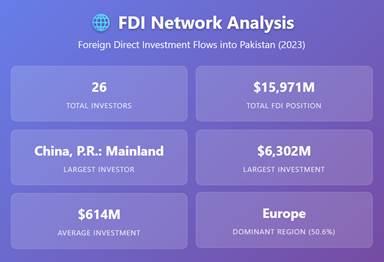
For the reader’s benefit, the FDI analysis of Pakistan is summarized in Fig. 2.
Fig. 2 – FDI Network Analysis of Pakistan, 2020 (left) and 2023 (right)
- India and Bangladesh
As promised, the next step is to show similar graphs for India and Bangladesh to allow the reader to compare the main players of the South Asia region (see Figs. 3 and 4 below).
Fig. 3 – Foreign Direct Investment Positions into India, 2020 (left) and 2023 (right)
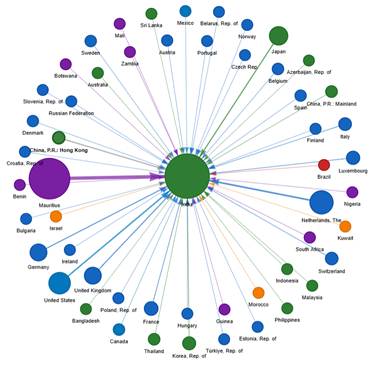
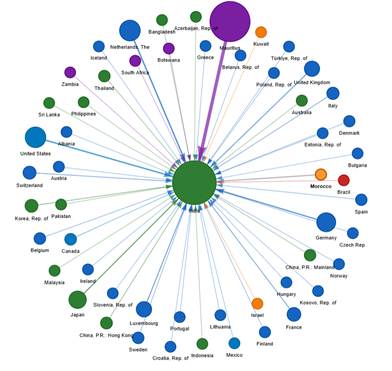
The case of India is an anomaly, since the largest investor in India for both years appears to be Mauritius, so this is not likely to be a substantive investment stemming from genuine foreign investors, but the outcome of some tax avoidance exercise, as mentioned earlier. Furthermore, investment from Mauritius to India is about one-third of the total investment in India and twice as large as the magnitude of the investment made by the second-largest investor. The analysis of substantive FDI in India would therefore be far more accurate if Mauritius (and other offshore financial centers like Luxembourg) were excluded. Even with this important caveat in mind, it is very clear, even at first glance, that India enjoys a much more central position in the global FDI network than its regional neighbor Pakistan, both in terms of the number of investors (in-degree centrality), standing at 53 and 54 for 2020 and 2023 respectively, and the total investment involved, standing at $ 355,642 million and $ 445,200 million in each year considered. These totals remain far larger, in fact, 15 to 20 times larger, than the investment made in Pakistan, even after deducting $ 118,000 million and $ 147,000 million of Mauritius.
The largest investor (of the substantive investment type) in India was the Netherlands both in 2020 and 2023, with $ 48,879 million and $ 49,786 million, respectively. This was followed by the United States with $ 42,291 million in 2020 and $ 49,453 million in 2023, when the U.S. had almost caught up with the Netherlands. Note that the United Kingdom, India’s former colonial master, ranked third in 2020 and fifth in 2023, signalling its declining role in the country, at least relative to other investors.
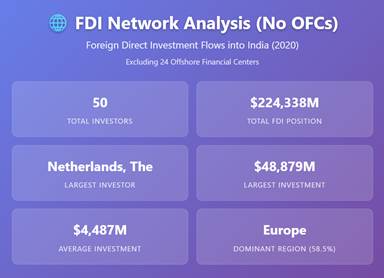
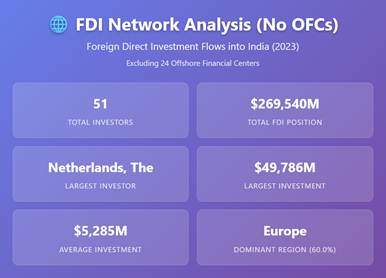
Once again, the FDI network analysis for India is shown in Fig. 4 below. Because of the misleading role played by the OFCs, particularly Mauritius, the summary table below shows the analysis without the offshore financial centers.
Fig. 4 – FDI Network Analysis of India (no OFCs), 2020 (left) and 2023 (right)
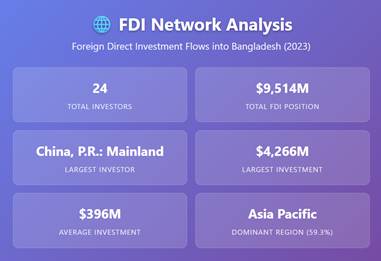
As for Bangladesh, its role in the global FDI network is illustrated in Fig. 5 below.
Fig. 5 – Foreign Direct Investment Positions into Bangladesh, 2020 (left) and 2023 (right)
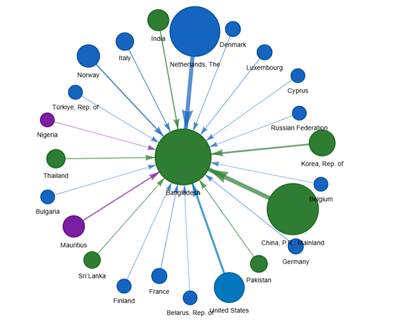
The situation is not too different from that of Pakistan, with 23 investors in 2020 (21 without the OFCs Mauritius and Luxembourg), increasing to 24 (22 without the OFCs) in 2023. Total investment, at $ 6,615 million in 2020, is less than half that of Pakistan, which reached $ 9,514 million in 2023. It therefore appears that both Pakistan and Bangladesh attract a similar number of investors, but these investors on average, invest considerably less in Bangladesh than they do in Pakistan.
The largest investor in Bangladesh, just like in Pakistan, was China with $ 1,711 million and $ 4,266 million in 2020 and 2023, respectively. The gap in investment of China towards Bangladesh, when compared to that towards Pakistan, was smaller in 2023 than in 2020.
Second place in 2020 was held by the Netherlands at $ 1,644 million, with the United States in third place at $ 742 million. The Netherlands was still the second largest investor in Bangladesh in 2023 at $ 1,933 million, but India took over third place at $ 585 million, the only case in the analysis so far of a neighbor being an important investor in the country concerned, in this case, Bangladesh. Here (Fig. 6 below) is the summary of the FDI network analysis for Bangladesh.
Fig. 6 – FDI Network Analysis of Bangladesh, 2020 (left) and 2023 (right)

- Trends Analysis
Next, we take a look at the evolution over time of Pakistan’s position in the global FDI network and that of its two neighbors, India and Bangladesh. This is done by analysing a series of line charts that cover the period 2009 – 2023 (see Fig. 5 below).
Fig. 7 – FDI Trends Analysis (2009 – 2023) – Excluding OFC
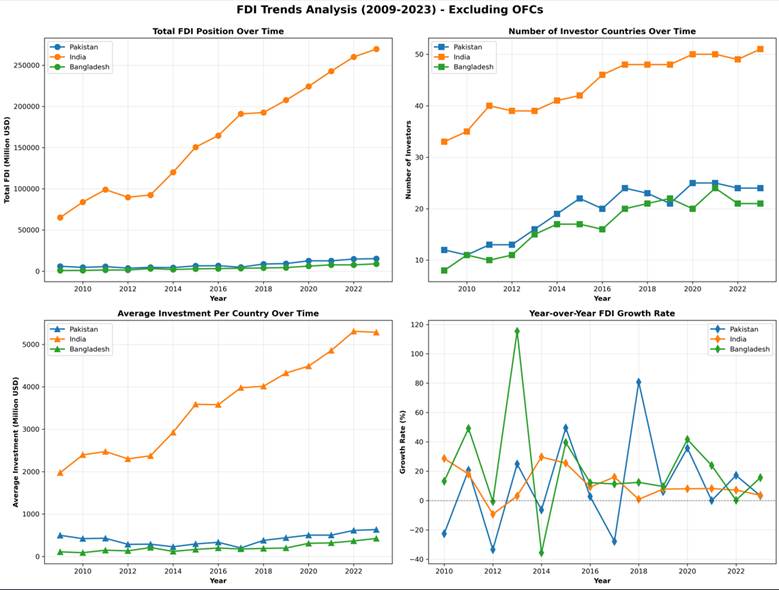
In the first panel, the top left corner, the three lines represent the total FDI position over the time period 2009-2023 for all three countries of our focus, Pakistan, India and Bangladesh. Pakistan experienced a steady, if slight, decline in FDI investment for half the time, which was followed by growth in the second half of the interval considered. This trend can also be seen by looking at the bottom right panel, which shows rates of growth of FDI investment. The blue line, representing Pakistan, is below zero (negative rates of growth) most of the time until 2017 and then remains above zero afterwards (positive rates of growth). the only country, of the three, where total FDI did not increase over the period. By contrast, Bangladesh boasts non-negative growth of FDI throughout, except for 2014. However, total foreign direct investment in Bangladesh does remain below FDI in Pakistan in the period under study. As for India, it is a clear outlier, both in terms of the magnitude of investment involved and its growth rate. The panel in the bottom left corner, which is about the average yearly investment rather than the total investment, follows a wholly similar pattern; thus, we do not dwell on it. Finally, the panel in the top right corner concerns the trend in the number of investor countries over time, and this panel, too, holds interesting information.
All three countries experienced an increase in the number of investors in the early part of the period considered, until 2017. Afterwards, the number of countries investing in all three of them remained approximately constant. We can interpret these trends in terms of the centrality of Pakistan, India and Bangladesh in the global FDI network. The chart shows that, while all three countries saw their centrality in the network increase until 2017, further progress in this direction has been harder to achieve more recently.
The Appendix to this article contains a table (Table A1) with the full FDI comparative analysis of Pakistan, India and Bangladesh, which should allow interested readers to dig deeper into the data.
- Conclusion
To conclude, the role played by Pakistan in the global FDI network emerges as being below its potential, at least until now. Although the number of investor countries has increased over the early part of the period under consideration, signalling a keen interest in the country early on, this increase stalled afterwards. The magnitude of the investment involved did not increase either. In fact, the positive rates of growth in total as well as average investment after 2017 can be explained by the fact that China’s FDI statistics in the IMF DIP dataset became available after that year.
When broadening the analysis to the other main regional players of South Asia, India and Bangladesh, we see that only India has been able to attract foreign investors to the extent that is justified by its size and promise. India will probably reap the benefit of being an attractive destination for foreign investors by exhibiting an improved economic performance in the near future. Bangladesh, however, appears to have remained below its own potential too, by exhibiting trends not too dissimilar to those of Pakistan, and, just like Pakistan, needs to devise suitable strategies to make itself more attractive to foreign investors in the future.
Appendix
| Table A1 FDI COMPARATIVE ANALYSIS: Pakistan, India, Bangladesh (2009-2023) | |||||||
| Year | Total Investors (in-degree centrality) | Total FDI position (in-degree centrality, weighted) | Largest Investor | Largest investment | Average investment | Dominant region | |
| 2009 | Pakistan | 12 | 5,987 | United Kingdom | 1,833 | 499 | Europe |
| India | 36 | 68,489 | United States | 21,752 | 1,902 | Europe | |
| Bangladesh | 9 | 877 | United States | 331 | 97 | Asia Pacific | |
| 2010 | Pakistan | 11 | 4,637 | United Kingdom | 1,481 | 422 | Europe |
| India | 38 | 87,321 | United States | 24,666 | 2,298 | Europe | |
| Bangladesh | 12 | 993 | United States | 296 | 83 | Asia Pacific | |
| 2011 | Pakistan | 14 | 5,958 | United Kingdom | 1,671 | 426 | Europe |
| India | 42 | 258,043 | Mauritius | 156,208 | 6,144 | Sub-Saharan Africa | |
| Bangladesh | 11 | 1,481 | United States | 326 | 135 | Asia Pacific | |
| 2012 | Pakistan | 15 | 4,305 | Netherlands, The | 1,322 | 287 | Europe |
| India | 42 | 198,599 | Mauritius | 105,604 | 4,729 | Sub-Saharan Africa | |
| Bangladesh | 14 | 1,535 | United States | 368 | 110 | Asia Pacific | |
| 2013 | Pakistan | 18 | 5,242 | Norway | 2,170 | 291 | Europe |
| India | 42 | 206,000 | Mauritius | 109,155 | 4,905 | Sub-Saharan Africa | |
| Bangladesh | 18 | 3,204 | Norway | 1,831 | 178 | Europe | |
| 2014 | Pakistan | 21 | 5,197 | United Kingdom | 1,665 | 247 | Europe |
| India | 44 | 233,512 | Mauritius | 108,308 | 5,307 | Sub-Saharan Africa | |
| Bangladesh | 20 | 2,123 | Korea, Rep. of | 460 | 106 | Europe | |
| 2015 | Pakistan | 24 | 7,479 | Netherlands, The | 1,956 | 312 | Europe |
| India | 45 | 256,534 | Mauritius | 100,225 | 5,701 | Sub-Saharan Africa | |
| Bangladesh | 20 | 3,024 | Netherlands, The | 520 | 151 | Europe | |
| 2016 | Pakistan | 22 | 8,253 | Netherlands, The | 2,025 | 375 | Europe |
| India | 49 | 272,031 | Mauritius | 101,689 | 5,552 | Sub-Saharan Africa | |
| Bangladesh | 19 | 3,381 | Netherlands, The | 567 | 178 | Europe | |
| 2017 | Pakistan | 26 | 6,287 | Netherlands, The | 1,773 | 242 | Europe |
| India | 53 | 296,588 | Mauritius | 99,798 | 5,596 | Europe | |
| Bangladesh | 23 | 3,773 | Netherlands, The | 712 | 164 | Europe | |
| 2018 | Pakistan | 25 | 10,208 | China, P.R.: Mainland | 3,614 | 408 | Europe |
| India | 51 | 315,665 | Mauritius | 120,975 | 6,190 | Sub-Saharan Africa | |
| Bangladesh | 24 | 4,221 | Netherlands, The | 964 | 176 | Asia Pacific | |
| 2019 | Pakistan | 23 | 10,926 | China, P.R.: Mainland | 3,927 | 475 | Europe |
| India | 51 | 334,911 | Mauritius | 119,516 | 6,567 | Europe | |
| Bangladesh | 25 | 4,897 | Netherlands, The | 1,220 | 196 | Europe | |
| 2020 | Pakistan | 27 | 14,127 | China, P.R.: Mainland | 6,219 | 523 | Asia Pacific |
| India | 53 | 355,642 | Mauritius | 118,009 | 6,710 | Europe | |
| Bangladesh | 23 | 6,615 | China, P.R.: Mainland | 1,711 | 288 | Asia Pacific | |
| 2021 | Pakistan | 27 | 13,466 | China, P.R.: Mainland | 7,485 | 499 | Asia Pacific |
| India | 53 | 400,462 | Mauritius | 144,241 | 7,556 | Europe | |
| Bangladesh | 27 | 8,160 | China, P.R.: Mainland | 2,204 | 302 | Europe | |
| 2022 | Pakistan | 26 | 15,480 | China, P.R.: Mainland | 6,823 | 595 | Asia Pacific |
| India | 52 | 426,632 | Mauritius | 153,776 | 8,204 | Europe | |
| Bangladesh | 24 | 8,239 | China, P.R.: Mainland | 2,995 | 343 | Asia Pacific | |
| 2023 | Pakistan | 26 | 15,971 | China, P.R.: Mainland | 6,302 | 614 | Europe |
| India | 54 | 445,200 | Mauritius | 147,789 | 8,244 | Europe | |
| Bangladesh | 24 | 9,514 | China, P.R.: Mainland | 4,266 | 396 | Asia Pacific | |
References
Clark, R., & Kentor, J. (2022). Foreign capital and economic growth: A social network analysis, 2001–2017. Sociological Perspectives, 65(3), 580–607. https://doi.org/10.1177/07311214211035150
International Monetary Fund. (2025). Direct Investment Positions (DIP) database. IMF Data. https://data.imf.org
Steenbergen, V., Liu, Y., Pinzon Latorre, M., & Zhu, X. (2022, June). The World Bank’s harmonized bilateral FDI databases: Methodology, trends, and possible use cases. World Bank.

About the Author
Antonio Marasco is an Associate Professor at Lahore University of Management Sciences (LUMS).
[1] The filtering of data is as follows: Net (Liabilities less Assets), All Financial Instruments (Equity and Debt Instruments), All Entities (Resident Financial Intermediaries and Resident Enterprises that are not Financial Intermediaries).
Any discrepancy with respect to other data sources, such as UNCTAD, may be due to differences in filtering of data.