Adaptation is one of the most used words in Pakistan’s climate debate. It usually refers to the steps farmers or households take to protect themselves from current and future damages. Evidence from Punjab suggests that farmers have already taken many of these steps, including using water to combat heat, switching seeds, and changing when they plant and harvest. What they cannot do alone is protect themselves against shocks that hit an entire community at once. That job rests with markets and the government, and in Punjab both are falling short.
The stakes are high. Agriculture is key to meeting the country’s food needs and providing direct livelihoods to over 11.7 million households. [1] A recent report estimates that failing to adapt could cost Pakistan up to $200 billion by 2050, with Punjab bearing the largest share.[2]
Most discussion of climate risk in Pakistan has focused on floods, which have become more frequent and damage lives, property, and economic activity. With floods, there is little question about who has to act, because the alternative, moving to safer areas, is rare. Preliminary evidence from the 2022 floods finds that only 1 percent of sampled households had migrated. [3]
Extreme heat and rainfall are a different case. They change gradually, season by season, and the usual assumption is that farmers will adjust to them on their own. Farmers do adjust, as I show below. But a hot spell or series of rainy days that hits everyone within a locality at the same time can make it infeasible for farmers to borrow from neighbours or rely on local labour markets who were hit just as hard. Expecting an individual to adapt to such a correlated shock suggests that the markets and institutions meant to coordinate action are either absent or misaligned with the changing environment.
The evidence below comes from several ongoing studies focused on Punjab.
The risk is seasonal, and only part of it is heat
Punjab has two cropping seasons, Rabi (dry) and Kharif (wet, monsoon), with wheat-paddy in the north and a wheat-cotton rotation in the south. The same farmer faces two risk environments each year.
Figure 1 plots crop-specific extreme degree days, meaning degree days above a crop’s optimal growing temperature. Since the 2000s, only wheat has seen a rise in crop-damaging heat. Degree days above 30 degrees Celsius for rice and 36 degrees Celsius for cotton show no rise.
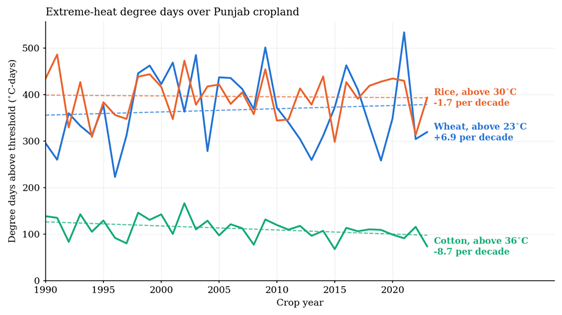
Figure 1: Crop-specific extreme degree days for wheat, rice and cotton in Punjab. Author’s calculation from ERA5-Land temperature aggregated to union councils by cropland area.
Figure 2 shows rainy days by season. The number is rising, mainly in the already wet season, reducing the dry periods available during the growing period. Total monsoon rainfall has risen from 285 mm in the early 2000s to 424 mm recently, driven more by more rainy days than by heavier rain on a given day. Thus, the environmental change that farmers face in the Kharif season is not heat but more frequent rain.
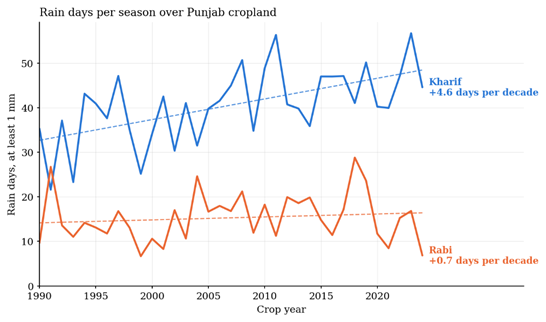
Figure 2: Number of rainy days by season in Punjab. Author’s calculation from CHIRPS rainfall aggregated to union councils by cropland area.
What farmers do about extreme heat and rainy days
Using plot-level data on wheat, rice, and cotton from 2015-19 for Punjab and matching it with union council-level extreme heat shocks and rainy days, initial findings from ongoing work with my co-authors show that crop-specific extreme heat reduces yields for wheat and rice, while the impacts on cotton bolls remain statistically insignificant.[4]
Wheat farmers respond to heat by applying more water, shortening the harvest period, and switching to heat-tolerant varieties where available, though they do not adjust varieties to rainy days. Rice and cotton farmers do not change water use, since additional rain likely reduces the need, and heat extends their harvest and picking periods. Cotton farmers also delay planting and are about 20 percent more likely to leave the field fallow in the Rabi season as rainy days increase.
Over the last thirty years, we cannot detect a yield response to extreme heat using district yields for any of the three crops. One reading is that the short-run adjustments described above (more water, an earlier harvest, and heat-tolerant seed) are enough to blunt heat damage over the longer run. With fewer than 30 districts, defined on 1990 boundaries, these estimates are too imprecise to confirm that, and a modest heat penalty cannot be ruled out. With respect to rainy days, we find that wheat yields fall with each additional rainy day, and in these estimates the 5.6 additional rainy days since 1990 offset roughly two-fifths of the yield gain that would otherwise have been realized.[5]
Although this has not been directly tested yet, some of these limited impacts may reflect a shift in cultivated area from cotton to rice, with rice expanding by 22 percent and cotton contracting by 20 percent, as observed in Punjab.
This shift toward a water-intensive crop during the Kharif season, combined with reliance on water to combat heat during the Rabi season, draws on the same aquifer. Whether this is what drove the decline in water tables shown in Figure 3 is not something we have tested. But this trend coincided with a sharp increase in tubewells from about 172,000 in 1981 to 1.1 million by 2018.[6] The 2024 agricultural census counts 895,828 solar-powered tubewells in Punjab against 341,455 running on diesel, i.e., most pumping now happens at close to zero marginal cost.[7] Farmers have worked the margins they control. What is left, an unregulated commons and the markets discussed next, is not theirs to work.
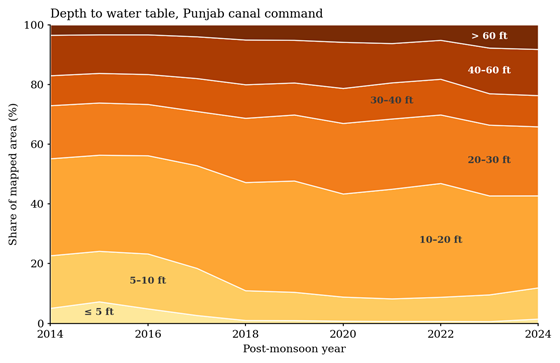
Figure 3: Water table depth in Punjab, Irrigation Department, Government of Punjab.
What the markets can do, but don’t
Regulation is one answer to falling water tables. The other is to spread the losses that farmers cannot absorb on their own. When one farmer has a bad harvest, they can usually borrow from relatives, lean on neighbours, or find work nearby. When the whole village has a bad harvest at once, those options disappear because everyone they would turn to has been hit too. We often call this covariate risk, and it is one of the key features of climate change.
Markets can help where village and local informal networks cannot, because a shock that hits one village may not necessarily hit all villages, even within the same district, province, or country. I focus on three: insurance and trade, which spread losses across regions, and innovation, which can reduce losses themselves.
Insurance
Punjab is the only province to have run a formal crop insurance programme in Pakistan. From Rabi 2017-18 to Rabi 2024-25, it offered a tehsil-level area-yield contract that paid PKR 30,000 per acre when a tehsil’s average yield fell below a benchmark. It reached a million farmers, and it paid PKR 1.4 billion to 152,758 cotton farmers after the 2022 floods. But it was fully subsidized, and in the World Bank’s own evaluation, 8 percent of farmers surveyed said they would pay between PKR 0 and PKR 500 for it.[8]
Area yield insurance is particularly valuable in the context of covariate risk if designed well, as it covers all perils, including floods, rainfall, extreme heat, and pests, that impact production in the area for which the contract is underwritten. However, designing an index contract remains a first-order challenge because of basis risk, which is a mismatch between one’s loss and the loss registered by the index. The feasibility study for the programme named basis risk as the main disadvantage of an area-yield policy and proposed addressing it by tightening the unit of insurance from the tehsil to the union council or eventually the village.[9]
In Rabi 2024-25, my co-authors and I conducted a randomized control trial across 101 villages in Punjab, covering 2,065 farm households. We elicited their beliefs about weather changes and how much they would pay for three hypothetical area-yield contracts, identical to the contracts offered by the government except for the scale at which claims trigger: district, tehsil, and individual.[10] A finer index tracks a farmer’s own losses more closely, so it should, in principle, lead to more demand and willingness to pay. Across farmers, this appears to be the case: those for whom a spatial index is a poor proxy for their own yield pay considerably less for insurance of any kind.
When we look at how the same farmer prices the three contracts, we find no such effect. This suggests that, at least in this market at this stage of development, narrowing the index will not bring in farmers who currently do not buy.
Information does play a role. Farmers in villages randomly selected to receive information about ten years of satellite temperature data for their own tehsil revised their beliefs; the perceived payout probability rose by 10% from a mean of 0.4, and the effect on willingness to pay was concentrated among farmers who underestimated heat.
Whether revised beliefs turn into demand depends on comprehension and trust. Among farmers who could explain the payout structure, information raised willingness to pay, while among those who could not, perceived payout probabilities rose, but willingness to pay did not. Among farmers who said they had not bought insurance because they did not trust the insurer, information raised willingness to pay substantially while barely moving their beliefs about the weather.[11]
Trade
Trade integration offers another avenue to derisk local shocks, as it enables unaffected regions to help affected regions, like individuals and local markets within a village helping smooth out idiosyncratic shocks, but now at larger spatial scales where those regions help each other smooth out correlated shocks.
Figure 4 maps every potential tehsil-to-district movement of wheat, rice, and cotton between 2017 and 2025. Of 12, 341 possible pairs, wheat used 64, cotton 43, and rice, the most traded, 170. Over the same period and network, onions used 1,281 pairs, and potatoes 1,095.
Wheat moves through government procurement and cotton farm-to-ginnery, so neither passes through the market the way vegetables do. The infrastructure that exists for vegetables does not seem to exist for the crops that cover three-quarters of Punjab’s cropped area. Another avenue is inter-country trade, which is currently almost negligible for staple crops. The poorest countries typically import about 9 percent of their food, while the richest import 55 percent, and raising trade integration to high-income levels is estimated to reduce the productivity damage from climate change by about 50 percent in low-income countries.[12]
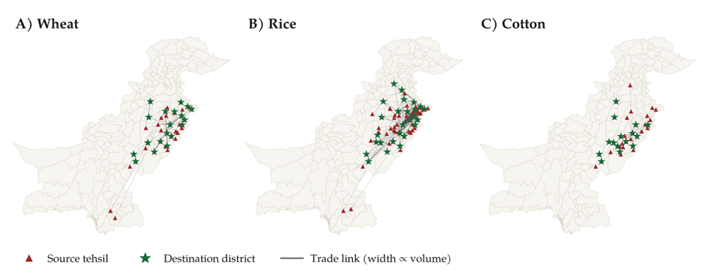
Figure 4: Tehsil-to-district trade links for wheat, rice and cotton, 2017–2025. Line width and opacity scale with total volume. Author’s calculations from tehsil-to-district crop movement data.
Innovation
Local innovation can provide the technologies farmers need to adapt. Wheat farmers already reach for heat-tolerant varieties where they can. Agricultural innovation is often directed at the ecologies of the countries that fund it, and existing evidence suggests international diffusion falls by around 30 percent at median ecological mismatch.[13] Climate change is likely to sharpen that, as innovators in rich countries would first turn to their own emerging problems. Waiting on diffusion assumes ecological threats would converge, which may eventually happen, but not necessarily in time for Punjab’s farmers. Local research capacity in the sector becomes much more important to pave pathways for adaptation, especially if ecological mismatches are to rise. Although recent trends show a promising rise in local innovation (Figure 5), its alignment with local conditions remains, to my knowledge, untested.
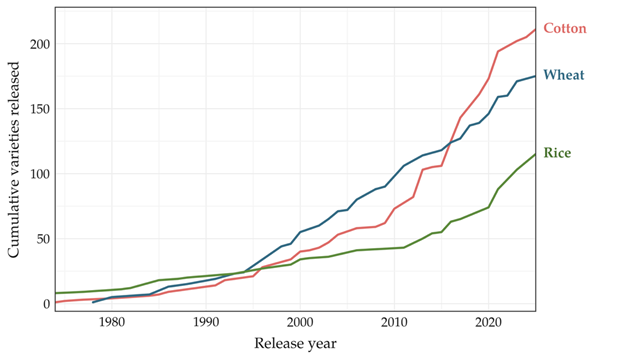
Figure 5: Cumulative crop varieties released nationally for wheat, rice and cotton, by year of release. Author’s calculations from the Federal Seed Certification and Registration Department’s List of Registered and Released Varieties.
An agriculture agenda
This article outlines what little we know so far about Punjab, and major gaps remain before anyone can design a sustainable food and livelihood policy. Local evidence is lacking on climate impacts on livestock productivity, the prevalence of pest risks and the damage they cause, and frictions underpinning limited intra- and inter-country trade and local innovation. We also need a better understanding of how farmers and markets outside Punjab are responding to climate change, and what lessons and opportunities for sharing risk exist across the country.
At a more macro level, agriculture’s share of GDP has stayed at about 23 percent of GDP since the early 2000s, and its share of employment has held at around 40 percent until very recently (Figure 6).[14] Over the same period, wheat and rice yields per acre have risen, while cotton yields have not. These gains may have allowed some men to leave farming, but most of them went into construction, informal services, or work abroad. In 2024, about 400,000 Punjabis registered for work overseas, half of them as unskilled labour.[15] It does not have to go this way. In Brazil, workers pushed off farms by drought first moved into informal jobs in cities, but over the following decade formal firms grew and absorbed them, where formal wages were free to adjust.[16] Pakistan has seen little of this, so a large share of its workers still depend on farming and, by extension, the weather.
This raises a question about how urban planning can accommodate workers arriving from rural areas and create accessible pathways to productive alternative livelihoods. It is also unclear how well rural policies and markets have adapted to changing gender dynamics in agriculture.
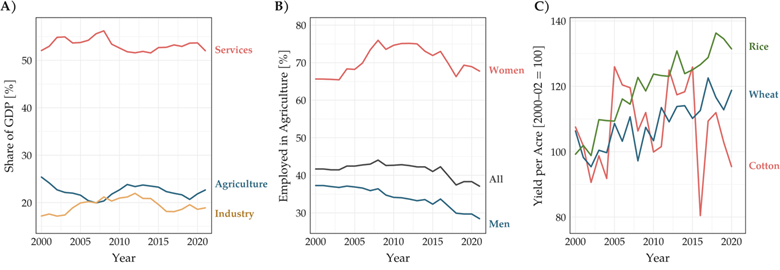
Figure 6: Sectoral value added, agricultural employment by sex, and land productivity. Panels A and B use World Bank World Development Indicators; Panel C is the author’s calculation from district crop statistics from the Crop Reporting Services.
Where the domestic room is
The wider literature finds that farms stay unproductive and workers stay put not because technology or opportunities are missing, but because institutions, markets, infrastructure, and uncertainty discourage their use.[17] All of these are domestic choices and need not wait on climate finance.
What the evidence here supports
- Regulate the water – Groundwater in Punjab is an unregulated common-pool resource with over a million private tubewells, and most now run on solar. Farmers use water to protect wheat yields from heat and are also turning to a water-intensive crop in Kharif, leaving less water available during the wheat growing season. Lack of regulation may protect short-term yield losses at the expense of long-term depletion of natural resources.
- Treat insurance demand as a literacy and credibility problem – Insurance markets remain an important avenue to manage correlated shocks. While basis risk matters, refining the spatial index will not recruit non-buyers at this stage if comprehension and insurer credibility remain low. Public-private partnerships can improve financial literacy, build trust and credibility in the community, and then design an appropriate contract.
- Redesign the instruments around who farms – Two-thirds of employed women in Pakistan work in agriculture, compared with a quarter of employed men. Extension services, credit products, and insurance need to move past the landowners and target the person who farms. Of the Punjab’s crop insurance programme’s 1.6 million policies, 88,293 went to women. Establishing who holds and works land is a modest exercise that the government can pair with its ongoing land digitization efforts.
What the emerging literature points to, and Punjab has not tested
- Improving trade linkages – The trade infrastructure that serves onions and potatoes does not seem to exist for wheat, rice, and cotton. Extending it to the crops that cover three-quarters of Punjab’s cropped area could let unaffected regions cover for affected ones, without a relief package.
- Fund the local varietal pipeline – Innovation abroad follows the ecologies that pay for it, so waiting for a variety bred elsewhere to suit our ecology is a bet against time. Thus, protecting what local breeders produce, and enforcing those protections, can make experimentation and innovation worth doing.
Several of the estimates come from work still in progress, and plenty of questions remain open. Punjab is not constrained by data, but it lacks the capacity to turn it into decisions, and researchers and organizations like CDPR and IGC can help bridge that gap alongside the departments that hold the records.
Acknowledgments: I am grateful to Ayesha Zaman at the CDPR, my co-authors, and the research teams for their contributions to the research projects discussed in this article.
[1] Pakistan Bureau of Statistics, Agricultural Census 2024 (the 7th Agricultural Census).
[2] Boston Consulting Group (2024), Bridging Pakistan’s Adaptation Financing Gap.
[3] Jalal, A., Simpson, P., Imtiaz, I. and Tajammal, Z. (2024), “How rural poor populations fared in Pakistan’s 2022 floods”, International Growth Centre, 3 June.
[4] Baylis, P., Burki, A. A., Malik, S. F., Memon, M. A. and Naeem, T. (2026), “Farm Adaptation in a Warmer and Wetter Punjab”, unpublished, working paper.
[5] Ibid., Table 6. The long-difference estimate is −0.97 (s.e. 0.25) per rainy day for wheat. Applied to the observed increase of 5.58 rainy days this implies a loss of 5.4 yield units against a realised gain of 7.3, or 43 percent of the counterfactual gain.
[6] Razzaq, A., Liu, H., Xiao, M., Mehmood, K., Shahzad, M. A. and Zhou, Y. (2023), “Analyzing past and future trends in Pakistan’s groundwater irrigation development”, Environmental Science and Pollution Research 30: 35413–35429.
[7] Pakistan Bureau of Statistics (2026). 7th Agricultural Census 2024: Punjab Provincial Report. Government of Pakistan. https://www.pbs.gov.pk/wp-content/uploads/2020/07/IAC-Punjab-Report-25-05-2026-1-1.pdf
[8] World Bank Independent Evaluation Group, Implementation Completion Report (ICR) Review: SMART Punjab P4R (P162446), Report ICRR0024491.
[9] Stutley, C., Kalavakonda, V. and Jansen, J. (2018), A Feasibility Study: Assessing the Potential for Large-Scale Agricultural Crop and Livestock Insurance in Punjab Province, Pakistan, World Bank.
[10] Baylis, P., Naeem, T. and Zappalà, G. (2026), “Demand for Crop Insurance: Evidence from Pakistan”, working paper.
[11] Baylis, P., Naeem, T. and Zappalà, G. (2026), “Demand for Crop Insurance: Evidence from Pakistan”, working paper.
[12] Nath, I. B. (2025), “Climate Change, the Food Problem, and the Challenge of Adaptation through Sectoral Reallocation”, Journal of Political Economy 133(6): 1705–1756, p. 1709.
[13]Moscona, J. and Sastry, K. A. (2025), “Inappropriate Technology: Evidence from Global Agriculture”, NBER Working Paper 33500.
[14] World Bank, World Development Indicators: agriculture, forestry and fishing value added (% of GDP); employment in agriculture, total, male and female.
[15] Government of Pakistan, Pakistan Economic Survey 2024-25, chapter on Population, Labour Force and Employment, reporting Bureau of Emigration and Overseas Employment registrations.
[16] Imbert, C. and Ulyssea, G. (2026), “Rural Migrants and Urban Informality: Evidence from Brazil”, Econometrica, 94: 911-939. https://doi.org/10.3982/ECTA21854
[17] Adamopoulos, T., Restuccia, D., Caunedo, J., Donovan, K., Mobarak, A. M., Moscona, J., Nath, I., & Sastry, K. (2026). Agricultural policies for growth (VoxDevLit Vol 4, Issue 1). VoxDev. https://voxdev.org/voxdevlit/agricultural-policies-growth